 BerryCade
 4. Getting to know the panel
The panel has three fixed areas:
- Side menu — the system sections. Opening a category closes the others. The installed version is shown at the bottom.
- Top bar — device name and uptime, the light/dark theme button and the user menu (change password and log out).
- Status bar (footer) — shows whether the configuration is in sync with the kernel and how many network sessions are active.
When a change is waiting for confirmation, a yellow bar appears at the top with the Confirmar (Confirm) and Reverter agora (Revert now) buttons.
4.1 Dashboard (Painel de Controle)
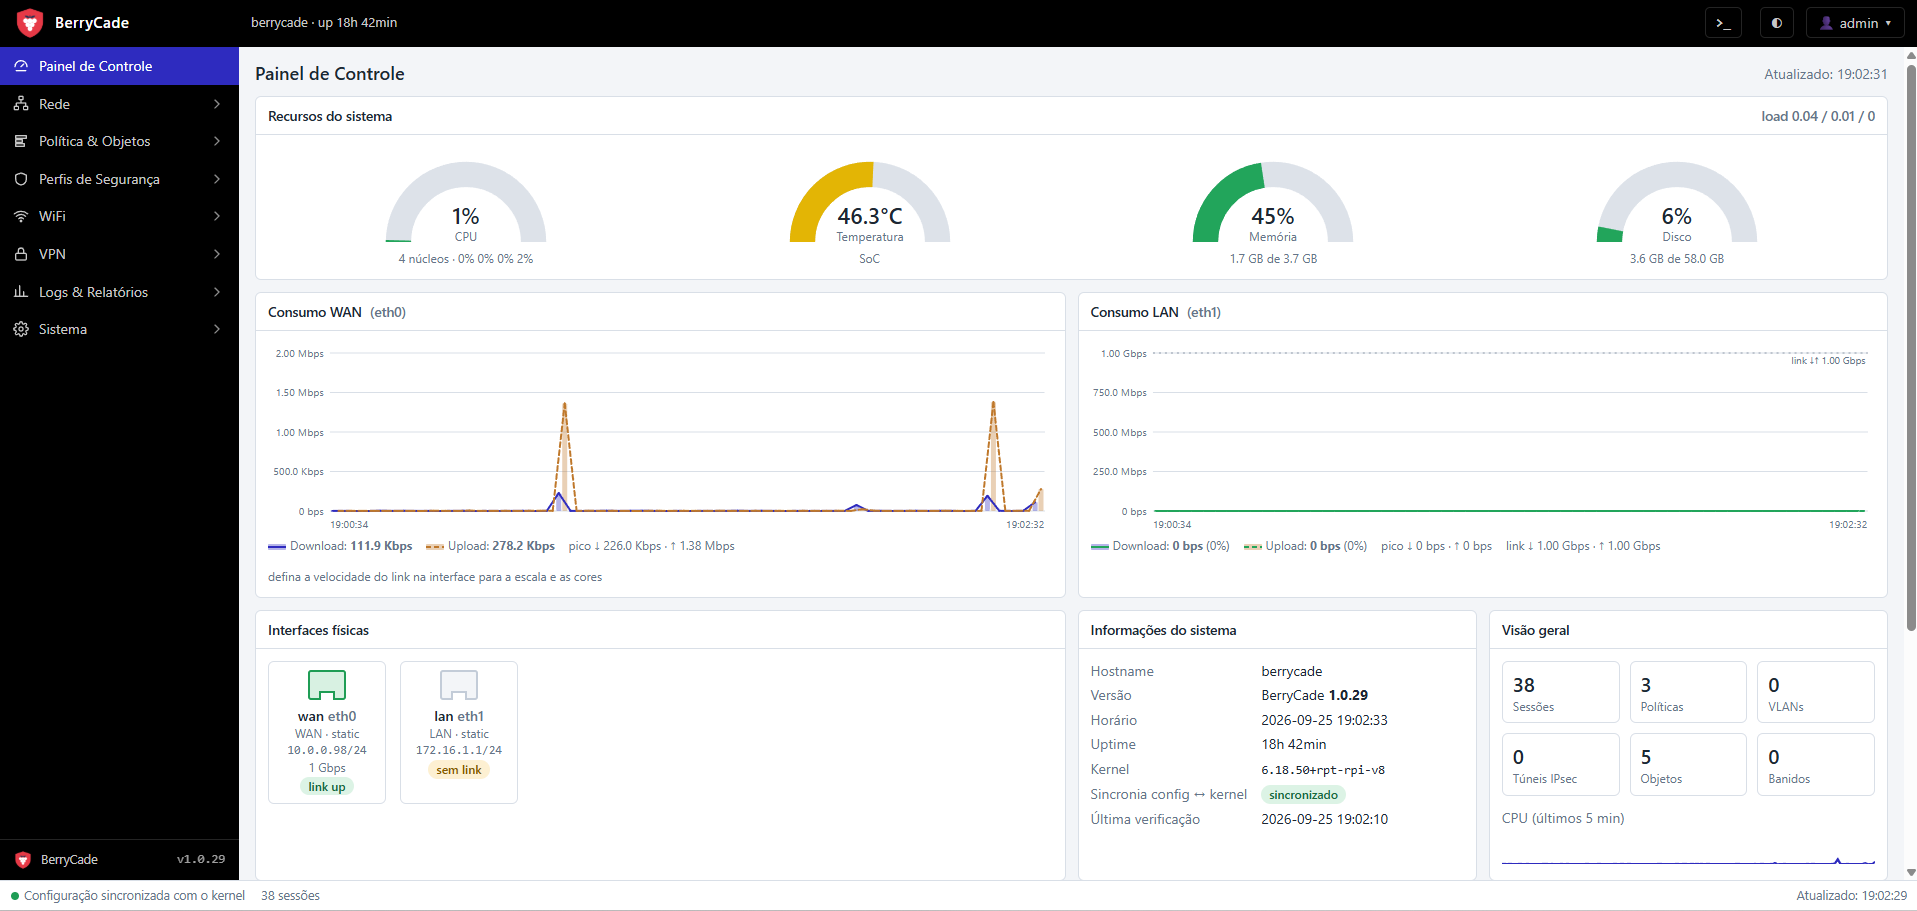
Figure 2 — Dashboard (Painel de Controle)
| Widget | Contents |
|---|---|
| Recursos do sistema (System resources) | Gauges for CPU (with per-core usage), processor temperature, memory and disk, and the load average. |
| Consumo WAN / LAN (WAN / LAN usage) | Real-time download and upload charts, with the peak for the period. |
| Interfaces físicas (Physical interfaces) | Each port with its role, addressing, speed and link state. |
| Informações do sistema (System information) | Hostname, version, time, uptime, kernel and the configuration ↔ kernel sync. |
| Visão geral (Overview) | Active sessions, number of policies, VLANs, IPsec tunnels, objects and banned devices, and the CPU chart for the last 5 minutes. |
| Serviços, IDS/IPS e bloqueios (Services, IDS/IPS and blocks) | Service status, recent IDS alerts and the latest blocked connections, with shortcuts to the logs. |